10 Video Marketing Stats Every Advertiser Should Know
Why does video marketing matter in 2026? Video marketing is increasingly popular this year. Most businesses have already adopted it to promote products, tell brand stories, and drive viewers to take action. According to Wyzowl’s 2026 survey, 91% of businesses use video as a marketing tool, and 82%…
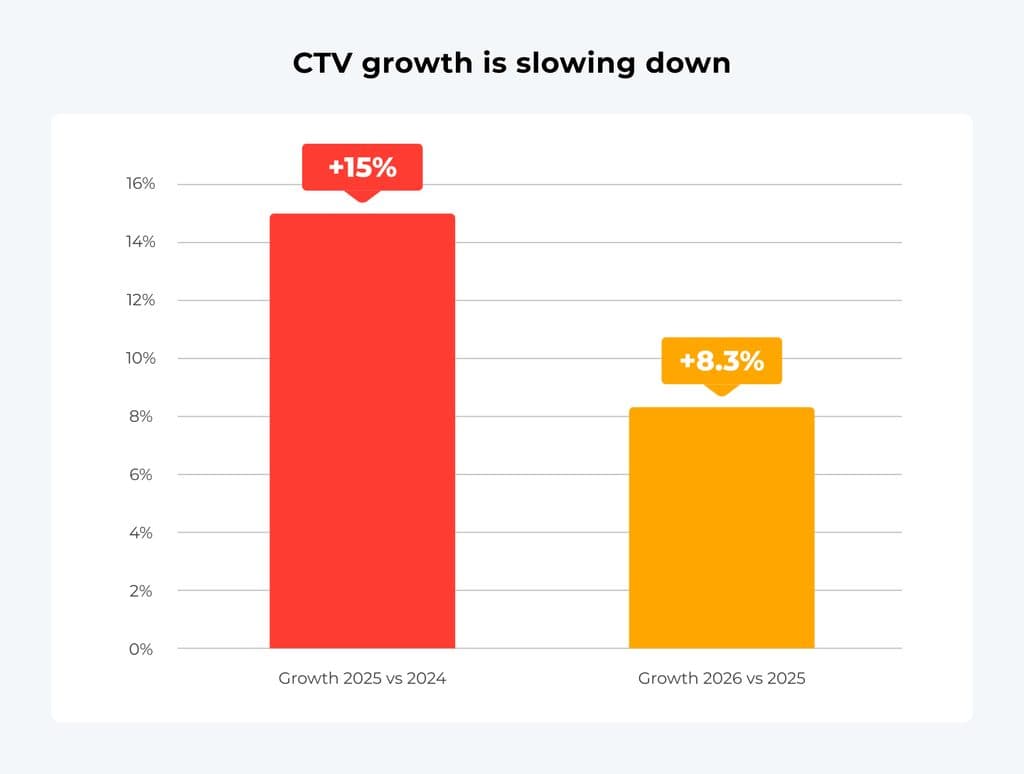
Why does video marketing matter in 2026? Video marketing is increasingly popular this year. Most businesses have already adopted it to promote products, tell brand stories, and drive viewers to take action. According to Wyzowl’s 2026 survey, 91% of businesses use video as a marketing tool, and 82% of video marketers say it has delivered a good ROI. Ad spend is following the audience, too. The IAB projects US digital video ad spend at $81.9 billion in 2026, up 11% year over year, while AI video is going mainstream: 63% of video marketers have used AI tools to create or edit videos, up from 51% a year earlier. Numbers look impressive, but the catch is measurement. Platforms count views, watch time, engagement, and conversions in their own ways, so reliable video content statistics are scarce, and benchmarks rarely align. We want to close these gaps and make stats actually useful. So, without further ado, let’s get to the numbers. The 10 video content stats to remember Short on time? Here are the numbers worth remembering: CTV time spent: growth slowed to 8.4% in 2026 vs. 15% in 2025. CTV ad spend: $28.79B (2024) → $33B (2025) → $37.70B forecast for 2026, per eMarketer. CTV invalid traffic: +19% in 2025 and a record +25% in Q1 2026. YouTube audience: ~2.53–2.70B MAU in 2025, growing 6–7% YoY. Meta audience: growth slowing from +6.8% to +4%, with ~3.72B MAU forecast for 2026. Meta ad spend: ~$16.75B in 2025 and ~$20.27B forecast for 2026 (+28%). TikTok ad spend: growing ~25–40%, but with no official data to verify it. Fake accounts: Meta removes ~4.5B a year, about 147% of its MAU. Programmatic volume: PubMatic’s processed impressions reached ~94.2T in Q1 2026 (+26% YoY). Mobile app invalid traffic: 41% in Q2 2026, vs. 21% on web and 26% on CTV. We’ll cover them all in detail below. Run video ads on RichAds’ Premium traffic! What is RichAds?Ad network for telegram ads,high quality push and popunder ads,domain redirect, native and display traffic source,buy push ads at $0.005 (CPC), pop ads at $0.5 (CPM),domain ads costs start from $1.5 (CPM), native ads — from $0.001 (CPC),ad network offers large volumes of traffic in more than 200 geos from Tier 3 to Tier 1. Video marketing statistics 2026: traffic, audiences, and ad spend by source The main goal of this guide is to understand what’s happening with video traffic sources in terms of volume and budget — where the audience is growing and where advertisers are spending more. Getting solid video marketing data here is hard: every source uses its own methodology for counting views due to tech differences. On top of that, the leading video marketing stats firms often only crunch numbers for one region, which doesn’t give you the global picture and makes comparisons messy. We flag those issues throughout, so you know which video content stats are solid and which are educated guesses. CTV/OTT video advertising statistics For this source, the most reliable data we found was for the US market, so we’re treating it as the global trend. Growth rates were compared from 2024 through 2026 (partial year) across three metrics: time spent, invalid traffic, and ad spend. Bottom line — all three metrics are growing, but ad spend and time spent growth are slowing down, unlike bot traffic. Here are the video content marketing stats: Time spent – how much time people spend watching content. Research shows growth slowing to 8.4% in 2026 vs. 2025, compared to 15% in 2025 vs. 2024. The market is moving from explosive growth into maturity.Worth noting that the data covers dozens of platforms, and their growth rates vary wildly. Some individual players, like Prime Video and Roku, are still growing 25–32% YoY, massively outpacing the market as a whole. Fun fact: in March 2026, Nielsen delayed publishing its February report because the household TV-connection growth numbers came in lower than the streaming companies wanted — so they “leaned on” Nielsen to keep it from going out. IVT = Invalid Traffic, or plain old bot traffic. Pixalate’s data shows a 19% jump in 2025 vs. 2024, and Q1 2026 vs. Q1 2025 shows 25% — a record high. Ad spend on CTV grew from $28.79B in 2024 to $33B in 2025, according to eMarketer, with a forecast of $37.70B in 2026 — that’s 19%-16%-13% YoY growth, respectively. What Are Pre-Roll Ads and How Do They Work Video content is conquering and dominating the digital space. In 2026, over 80% of users prefer watching videos to reading text, and affiliates can leverage this trend. RichAds ad network launches a new format – pre-roll video ads. They are highly visible, engaging, and effective, and this guide covers everything you need to run successful pre-roll campaigns. Continue reading RichAds Blog Social video content statistics This category includes a bunch of individual private companies that don’t disclose their numbers, and since there’s no single platform to analyze them through, we have a few disclaimers on the stats below. We’re looking at the three biggest social platforms — YouTube, TikTok, and Meta — across audiences, fake accounts, and ad spend. TikTok and YouTube don’t regularly publish official global audience numbers, and Meta stopped disclosing its share of fake accounts altogether back in 2023. The video content stats below were pulled from third-party sources and may vary significantly across ranges. Audience / MAU202420252026 forecastYouTube(Alphabet doesn’t disclose MAU in its reports — only ad revenue. Figures are unofficial estimates from DataReportal/Statista/Backlinko)~2.40–2.50B~2.53–2.70B (+6.7%)~2.70–2.85B (+6.1%)TikTok(ByteDance is private — there’s no official data at all. All figures are third-party estimates from Backlinko, DemandSage, Dreamgrow, etc.)~1.50–1.70B~1.6–2.2B (+6.6%–29%)~1.0–2.2B (-40%–0%)Meta(Official quarterly reports since 2024 cover DAU only — investor.atmeta.com. We’re extrapolating that to MAU, even though it’s not 100% accurate)~3.35B~3.58B (+6.8%)~3.72B (+4%) YouTube shows the most stable and predictable trajectory of the three — growth is holding at 6–7% YoY. Meta’s audience growth is slowing — from +6.8% down to +4% over three years — but it’s still the only platform with fully official, verifiable data. TikTok is the only platform where you genuinely can’t draw a solid conclusion, since the estimated spread is too wide and none of the data is official. Pre-Roll Ad Cost: Pricing Guide for 2026 Pre-roll is a highly popular video ad format in 2026 because it engages viewers and drives conversions. But how much will this effectiveness cost? This guide provides the answer. You’ll get pre-roll ad pricing for YouTube, X (Twitter), Facebook, and RichAds — all the top platforms for video advertising. Continue reading RichAds Blog Ad spend / avg. Monthly202420252026 forecastYouTube(Official Alphabet data, public company, SEC filings)~$3.01B~$3.36B (+11.8%)~$3.29B (+11%)TikTok(NO official data — all figures from third-party analytics firms like DemandSage, Growth Navigate, etc.)~$1.97B~$2.76B (+40.5%)~$2.90–3.66B (+5%–31%)Meta(Official data — SEC-regulated filings, direct Meta press releases)~$13.71B~$16.75B (+22%)~$20.27B (+28%) The most reliable numbers come from YouTube, and they show the most modest, predictable growth of ~11–12%. There’s no official TikTok data, and that’s the one showing the most impressive growth at ~25–40%, which can’t be verified. Meta sits in between: fully official data and accelerating revenue growth, pointing to a strategy focused on monetizing its existing base rather than acquiring new users. Fake accounts, avg. removed per yearRatio (removed / MAU)YouTube ~25M spam channels~42%TikTok ~1B~53% (more than half the audience)Meta ~4.5B~147% (more than the MAU figure itself!)Source: surfshark.com Meta has the highest account-removal rate: either they’re dealing with a massive bot attack, or they run the most aggressive detection system. 16 Top Examples of Effective Pre-Roll Ads in 2026 Pre-roll video ads are among the most effective affiliate formats for promoting offers at scale. But not every video ad works well. To help you understand how to make a really good ad, we’ve gathered 16 pre-roll ad examples broken down by vertical. Continue reading RichAds Blog Stats on mainstream and non-mainstream video marketing Here we’ll talk about video ad networks. There are two main types to compare: Mainstream video network. Since buying impressions site by site is a nightmare, you need a network with an already-built publisher base: regular sites, video hosting platforms, news portals, entertainment sites, and so on. Safe for white-hat, compliant brands. Non-Mainstream video network. Same idea as above, except the traffic comes from publishers like torrent sites, file-sharing platforms, VPN apps, pirated content streaming, and so on — basically all the non-premium video inventory that suits grey verticals. Now that we’ve cleared the sources, let’s see their video advertising statistics. Run video ads on RichAds’ Premium traffic! What is RichAds?Ad network for telegram ads,high quality push and popunder ads,domain redirect, native and display traffic source,buy push ads at $0.005 (CPC), pop ads at $0.5 (CPM),domain ads costs start from $1.5 (CPM), native ads — from $0.001 (CPC),ad network offers large volumes of traffic in more than 200 geos from Tier 3 to Tier 1. Impressions Almost all the video inventory spans roughly 15–20 networks and DSPs. Add up the numbers each of them claims publicly, and you get about 100 billion impressions per day. That equals showing every person on Earth a video ad 12 times a day. Sounds not real. Why this number can’t actually be calculated: In the programmatic ecosystem, the same piece of inventory can pass through multiple intermediaries at the same time; Differences in who’s reporting what: “impressions processed” ≠ impressions sold — the former is the entire volume of ad requests/bid requests that technically passed through the network’s/DSP’s infrastructure, including a huge chunk of “empty” requests that never won an auction; The same publisher works with several networks at once and sometimes sells the same slot to different networks at different times of day or rotates between them; Almost everyone inflates their numbers or just forgets to update the ones already posted on their own sites and their partners’ sites. So while you can’t calculate the total impression volume across all networks, there are big SSPs and DSPs that are required to disclose their financials, and you can pick up some clues there. However, public, white-hat companies don’t carry non-mainstream traffic. PubMatic (Nasdaq: PUBM) — works with roughly 1,950 major publishers and app developers. Processed impression volume grew from ~75 trillion per quarter (Q1 2025) to ~94.2 trillion (Q1 2026) — 26% YoY growth. Keep in mind: processed impressions ≠ real/sold impressions. The Trade Desk (Nasdaq: TTD) — the largest independent DSP — shows video spend volume growing roughly +24% YoY. Another indirect signal of growth. How Online Video Ads Perform and What to Measure Video is now the biggest part of internet traffic, and affiliates are increasingly switching to this format to promote CPA offers. But not everyone understands how video ads perform or which metrics to monitor. This guide from the RichAds ad network team explains the performance of online video ads in plain language. You’ll know the metrics and current video ad benchmarks, and learn how effective video ads… Continue reading RichAds Blog Invalid traffic Here are all the video advertising statistics we could dig up from open sources. Note that the mobile traffic numbers below also apply to the social source. PeriodWebMobile AppCTV (for comparison)Q2 2025(Pixalate Q2 2025 Global Ad Fraud Benchmarks)19%29%18%Q3 2025(Pixalate Q3 2025 Global IVT & Ad Fraud Benchmarks)21%33%19%Q1 2026(Pixalate Q1 2026 Ad Fraud Benchmarks Report for EMEA/North America)20%39%25%Q2 2026(Pixalate Q2 2026 Ad Fraud Benchmarks Report for EMEA/North America)21%41%26% One possible reason fraud is lower on the web than on mobile: the web is a well-oiled, mature part of the industry. JS-based verification, browser fingerprinting, CAPTCHA, and cookie-based tracking — these have been around for decades, which pushed fraudsters toward other areas. Mobile video advertising is the fastest-growing segment by budget, so there’s more profit in it for everyone. And CTV, by the way, has 26% fraud growth — higher than the web, but lower than the app. Basically, it’s a middle ground: not as strong protection as the web, and impression prices are high enough to make fraud worth the effort. Run video ads on RichAds’ Premium traffic! What is RichAds?Ad network for telegram ads,high quality push and popunder ads,domain redirect, native and display traffic source,buy push ads at $0.005 (CPC), pop ads at $0.5 (CPM),domain ads costs start from $1.5 (CPM), native ads — from $0.001 (CPC),ad network offers large volumes of traffic in more than 200 geos from Tier 3 to Tier 1. RichAds video marketing data One thing we can do for certain — pull real numbers from the RichAds platform and look at them from several angles of advertiser performance. RichAds works across a range of verticals: iGaming, Finance, Nutra, Utilities, Games, and Ecommerce. However, most benchmarks have been collected for iGaming, so that’s where we’ll dig in. Top 20 countries by impressions, with CTR and CPM, for the iGaming vertical CountryImpressions, monthlyCTR, %CPM, $IND1.09 bln50.10IDN267 mln1.80.13THA114 mln2.50.17DEU74.6 mln1.80.45USA67.3 mln1.70.59VNM54.8 mln40.99BRA43.7 mln61.16TUR43.6 mln4.60.45JPN42.3 mln5.11.17MYS33.2 mln1.80.16PHL29.1 mln4.30.08FRA27.5 mln2.31.00COL27.4 mln3.80.25AUS23.1 mln2.40.93POL20.5 mln1.90.30CHN20.4 mln1.70.37BGR20.4 mln30.35PAK20.0 mln8.61.00CAN19.81 mln2.10.67BGD16.83 mln4.61.00 You can find more info in our Research on iGaming video advertising in 2026! How to Promote Gambling with Video Ads Video is the top affiliate ad format in 2026, especially for Gambling promotion. This guide from the RichAds ad network team walks you through the peculiarities of Gambling video ads. You’ll learn where to run them, which creative angles convert, and how to launch a campaign that brings profits. Continue reading RichAds Blog So what advice can we give media buyers looking at these numbers? Underpriced markets — high CTR at low CPM Audience engagement in these GEOs is clearly higher than what the current price “justifies” — meaning advertiser competition hasn’t caught up to the traffic quality yet: PHL (Philippines) — 4.3% CTR at a CPM of just $0.08. The engagement-to-price ratio here is the best in the whole table — noticeably better than even India’s. This should be the first pick for testing. TUR (Turkey) — 4.6% CTR at a $0.45 CPM, while GEOs with similar CTR (JPN, BRA) run CPMs almost 2–3x higher. Looks like a market that competition hasn’t “warmed up” yet. COL (Colombia) and IDN (Indonesia) fall into this bucket too: decent CTR at a CPM that’s a fraction of what Tier-1 countries with similar engagement charge. IND (India) — a massive volume (1.09B impressions) at a $0.10 CPM with a solid 5% CTR — a great spot for racking up volume fast and testing creatives at scale. But cheap Tier-3 traffic in gambling often runs into trouble at the deposit stage — use this volume for A/B-testing creatives/landers, not as your main ROI source, without first checking how the funnel performs all the way to FTD. Top 20 Markets for Video Advertising and What They Cost Video is the fastest-growing ad format in 2026, and affiliates are increasingly shifting budgets to it. The main questions they face are where to buy video traffic and which GEO fits their offer. This guide from the RichAds ad network team covers those in detail. You’ll know the 20 best GEOs for video ads, their prices, traffic volumes, and top verticals that work there. Continue reading RichAds Blog Pricier markets with weak CTR — proceed-with-caution zone DEU, USA, FRA, AUS, CAN — all sit at a 1.7–2.4% CTR, but CPMs of $0.45–1.00 — noticeably higher than GEOs with similar or even better CTR. There are two possible explanations here, and the buyer needs to figure out which one applies to their specific offer: Positive scenario: these are high-spending Tier-1 markets — the low CTR is offset by much higher lead quality and deposit value, so the premium is justified. Negative scenario: the high price is simply a byproduct of heavy competition, not real audience quality in the vertical. Conclusion Taken together, these video marketing statistics point in one direction: video keeps growing, but the easy gains are behind us. CTV is maturing, with time spent and ad spend growth both slowing. Social video splits three ways: a steady YouTube, a Meta that monetizes its existing base, and a TikTok whose numbers nobody can verify. Programmatic networks process enormous impression volumes, yet nobody can say how many are real. And invalid traffic is climbing almost everywhere, with CTV hitting a record and mobile apps leading the pack. For advertisers, these video marketing stats mean two things: plan budgets around verified data, and protect them with traffic quality checks. Work with partners that are transparent about their inventory, build your own conversion and ROI benchmarks instead of trusting industry averages, and test formats before scaling. Ready to put these numbers to work? Launch your video advertising campaign with the RichAds ad network and see how pre-roll ads perform for your offer. Run video ads on RichAds’ Premium traffic! What is RichAds?Ad network for telegram ads,high quality push and popunder ads,domain redirect, native and display traffic source,buy push ads at $0.005 (CPC), pop ads at $0.5 (CPM),domain ads costs start from $1.5 (CPM), native ads — from $0.001 (CPC),ad network offers large volumes of traffic in more than 200 geos from Tier 3 to Tier 1. Research on iGaming video advertising in 2026 You need to launch a test video ad campaign, so you ask AI how to do it and immediately run into a wall of terminology. You get confused and start digging in. Turns out, it’s more complicated than push or pop. To clear things up, I put together a practical guide – zero fluff: only facts, numbers, and recs. Continue reading RichAds Blog FAQ How many businesses use video marketing?+ About 91% of businesses use video as a marketing tool in 2026. Among marketers who don’t use video yet, 67% plan to start this year. Does video marketing actually increase conversions?+ Marketers say yes. In the Wyzowl survey, 83% of video marketers said video has directly increased sales, and 85% said it helped them generate leads. These results are self-reported, though, and 17% of marketers don’t track their video spend at all, so treat these video content marketing stats as directional and test conversion lift on your own campaigns. How much is spent on video advertising worldwide?+ There’s no single agreed global figure, because video marketing data depends on what each forecaster counts. The IAB projects US digital video ad spend (CTV, social video, and online video) at $81.9 billion in 2026, up 11%. Globally, WARC forecasts spend on VOD and streaming platforms at $48.4 billion in 2026, up 15.1%. What is the best video length for marketing?+ The length depends on the platform and the goal, but shorter usually wins. Most marketers use videos between 30 seconds and 2 minutes, which are the most effective. Wistia’s analysis of more than 13 million videos found that videos under a minute average a 52% engagement rate, meaning viewers typically watch about half of the video. The RichAds ad network experts recommend using short-form videos, about 15-30 seconds. Which platform brings the most video engagement?+ It depends on how you measure it. In Dash Social’s H1 2026 benchmarks, TikTok leads on engagement rate (3.4%, down from 3.9%), Instagram Reels average 2.7%, and YouTube leads on sustained attention with an average view rate of 90%. Advertisers also rate RichAds as one of the most effective video ad networks, delivering premium-quality traffic. How many marketers use AI to make videos?+ Some reports say that 63% of video marketers have used AI tools to create or edit marketing videos in 2026, up from 51% a year earlier. Other surveys report higher figures — around 84% of marketers. According to the RichAds video marketing research, AI is also used by publishers to test ad placement, pricing, and timing in real time. Some report revenue gains of 20–30% from such automation. The post 10 Video Marketing Stats Every Advertiser Should Know appeared first on RichAds Blog.